Chapter 3 Unsupervised learning and time series
3.1 Clustering
3.1.1 Unsupervised learning
- Regression / classification
- Learns from a dataset that includes both input \(X\) and output \(y\)
- Implies building an input-output model \(y=F(X)\)
- Constructs a model that does prediction \(\hat{y}\)
- Unsupervised learning
- We only have input data \(X\)
- There is no value (regression) or label (classification) for output \(y\)
- There is no prediction \(\hat{y}\)
- Aims at finding information about the data
- Typical tasks in unsupervised learning
- Clustering: reducing rows
- Dimensionality reduction: reducing columns
- Generative networks
- Typical applications in unsupervised learning
- Preprocessing before classification / regression
- Blind Source Separation
- Descriptive statistics
- Market segmentation
- Recommender systems
- Social network analysis
- Anomaly detection
- Visualization
3.1.2 Clustering
- Data is partitioned into several distinct groups
- Instances within each group are quite similar to each other
- Instances in different groups are well separated
- Clustering aims at revealing a natural classification of data
In mathematical terms, in clustering
- We have data \(X=\{x_1,\dots x_n\},x_i \in \mathbb{R}^m\)
- We look for a partition into groups or clusters \(C_1,\dots C_k\)
- Each data point is assigned to a cluster \(x_i\in C_j\)
- Clusters are disjoint \(C_j\cap C_l=\emptyset\)
- Clusters include all data \(\cup_j C_j=X\)
- Usually the number of clusters is much smaller than the original number of rows \(k\ll n\)
3.1.3 The \(k\)-means algorithm
- The number of clusters \(k\) is an hyperparameter that must be set
- The algorithm computes \(k\) cluster centroids \(\mu_1,\dots \mu_k\in \mathbb{R}^m\)
- Each data instance is assigned to the nearest centroid
- The \(k\)-means algorithm is an optimization problem \(\min_{\mu_i} \frac{1}{n}\|x_i-\mu_{A(i))}\|^2\)
- The \(i\)-th data instance is assigned to cluster \(A(i)\)
- The centroid of cluster \(A(i)\) is \(\mu_{A(i)}\)
\(k\)-means is an iterative algorithm
- Initialize centroids
- Repeat until there is no change
- Assign each data instance to the closest centroid: \(A(i)=\min_j \|x_i-\mu_j\|\).
- Compute centroids as the average of the points that belong to its cluster: \(\mu_j=\frac{1}{|C_j|} \sum_{x_i\in C_j} x_i\)
\(k\)-means is an example of EM (Expectation-Maximization) algorithm:
- Assign each data instance to the closest centroid: Maximization of fitness (or minimization of error)
- Move the centroid to the center of mass, which gives minimum average distance: Expectation
3.1.4 Example
- k-means in R is computed with the command kmeans
- Consider as an example the iris database without the species variable.
datos = iris[, 1:4]   # Numerical data !!!
n_clusters = 2
clustering = kmeans(datos, n_clusters)
print(clustering$centers)- Plot only variables 1 and 4:
plot(datos[,1], datos[,4], xlab=colnames(datos)[1], ylab=colnames(datos)[4])
for (i in 1:n_clusters) {
  datos_cluster = datos[clustering$cluster==i,]
  color = colors()[i*30]
  lines(datos_cluster[,1], datos_cluster[,4], col=color, xlab="", ylab="", xaxt="n", yaxt="n", xlim=c(4,8), ylim=c(0,4), type="p")
  lines(clustering$centers[i,1], clustering$centers[i,4], col=color, pch=10, type="p", cex=3)
}
3.1.5 Hyperparameters of \(k\)-means
Main hyperparameters of \(k\)-means:
- Optimal number of clusters \(k\)
- It depends on the application
- If \(k=m\) each data point is a cluster (useless)
- If \(k=1\) all data points belong to the same cluster (useless)
- Centroid initialization. There are many strategies
- Random initialization may fall far from data or unequally distributed
- Convergence may be slow
- Some clusters may remain empty
- Centroids can be chosen among data
- At least one data instance belongs to every cluster
- Random initialization may fall far from data or unequally distributed
- Every choice of hyperparameters must be run several times, as in all stochastic algorithms
- The package kmeans in R automatically repeats the run and selects the best result (parameter nstart)
3.1.6 Validation in unsupervised learning
- In unsupervised learning there is no error to validate results
- Intra-class variance is a measure of clustering compactness
- But intra-class-variance simply decreases with the number of clusters
datos = iris[,1:4]   # Numerical data !!!
errores = vector(length=20)
for (i in 3:20) {
  results = kmeans(datos, i, nstart=10)
  errores[i] = results$tot.withinss
}
plot(3:20, errores[3:20], xlab="k", ylab="error")- Intra-class variance is 0 when each point is a cluster \(k=m\)
- A large number of clusters is not useful
3.1.7 Extrinsic validation
- When data include classes, these are not used for clustering
- Clustering can be compared to original classes
- There is no guarantee that clusters will be in the same order (or even similar) to classes
datos = iris[, 1:4]   # Numerical data !!!
# Clustering
n_clusters = 3
clustering = kmeans(datos, n_clusters)
print(clustering$centers)
# Compute averages of classes (not clusters!)
print("Media setosa")
print(colMeans(iris[iris$Species=="setosa",1:4]))
print("Media versicolor")
print(colMeans(iris[iris$Species=="versicolor",1:4]))
print("Media virginica")
print(colMeans(iris[iris$Species=="virginica",1:4]))
# Plot classes
plot(datos[iris$Species=="setosa", 1], datos[iris$Species=="setosa", 4], col = 30, xlab=colnames(datos)[1], ylab=colnames(datos)[4], xlim=c(4,8), ylim=c(0,4))
lines(datos[iris$Species=="versicolor", 1], datos[iris$Species=="versicolor", 4], col = 60, type="p")
lines(datos[iris$Species=="virginica", 1], datos[iris$Species=="virginica", 4], col = 90, type="p")
# Plot clusters
for (i in 1:n_clusters) {
  color <- colors()[i*30]
  lines(clustering$centers[i,1], clustering$centers[i,4], col=color, pch=10, type="p", cex=3)
}
# Print confusion matrix
clust_fac <- as.factor(clustering$cluster)
print(table(iris$Species, clust_fac))
# factor(clust_fac, levels=rev(levels(clust_fac)))3.2 Dimensionality reduction
In dimensionality reduction
- Initial data forms \(n\times m\) matrix
- The aim is to reduce the number of columns to \(k\ll m\)
- Applications
- Visualization (k=2)
- Sensitivity analysis: determine which features contain important information
- Data compression
- Preprocessing before supervised learning
- Theoretical analysis show that data has an intrinsic dimension
Types:
- Feature selection: some of the existing columns are used
- Feature extraction or projection: new columns are created
Example: data lies on a plane that must be discovered
library(pracma)
library(scatterplot3d)
grid = meshgrid(runif(15), runif(15))
x = matrix(grid$X, 225, 1)
y = matrix(grid$Y, 225, 1)
z = 2*x + 3*y + runif(225)*0.4-0.2
scatterplot3d(x,y,z)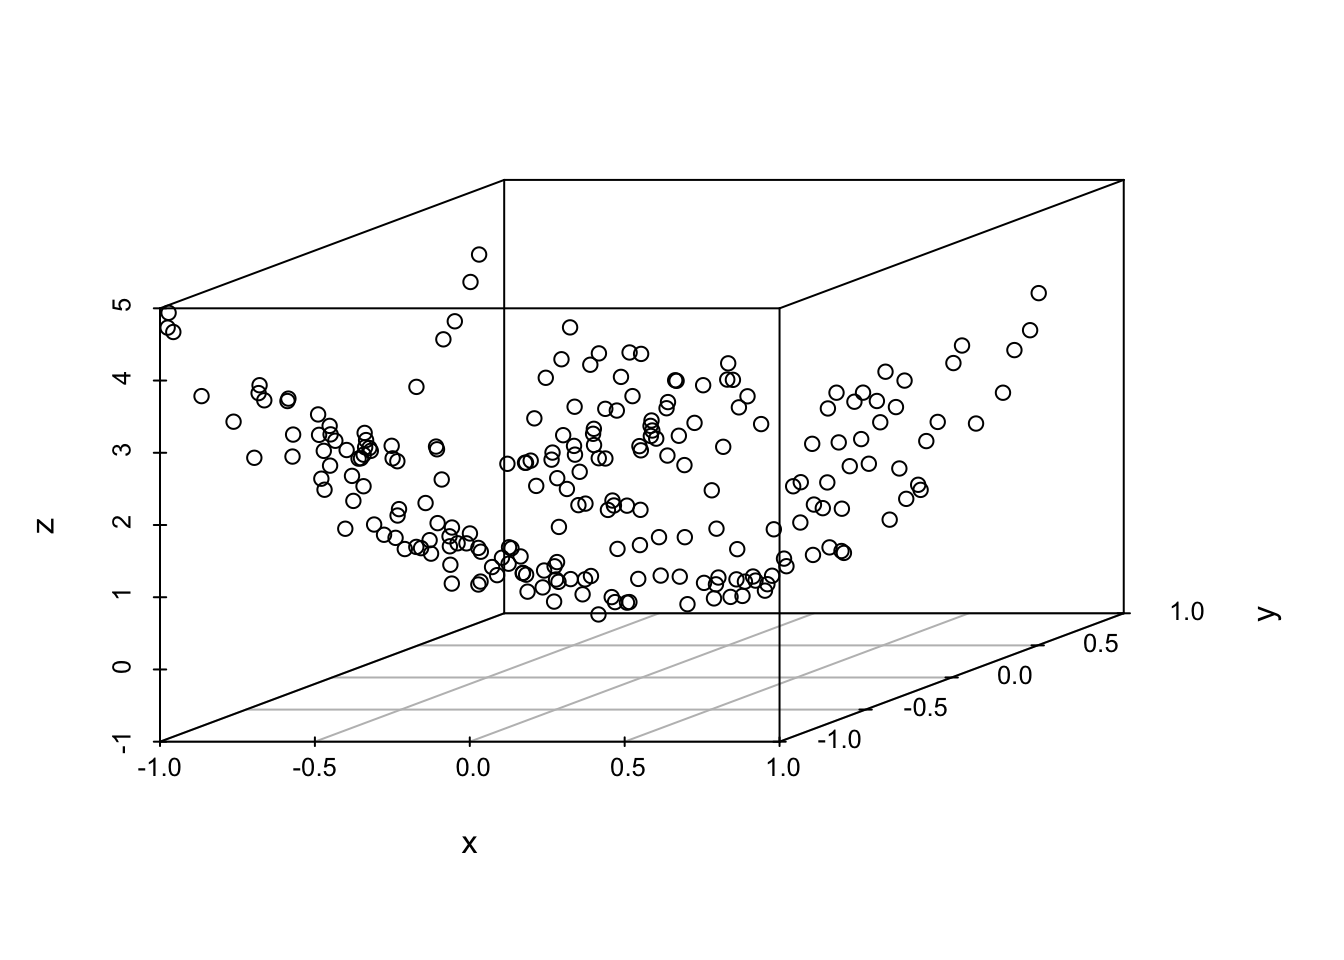
Example: data lies on a nonlinear surface that must be discovered
library(pracma)
library(scatterplot3d)
grid = meshgrid(runif(15)*2-1, runif(15)*2-1)
x = matrix(grid$X, 225, 1)
y = matrix(grid$Y, 225, 1)
z = 2*x^2 + 3*y^2 + runif(225)*0.4-0.2
scatterplot3d(x,y,z)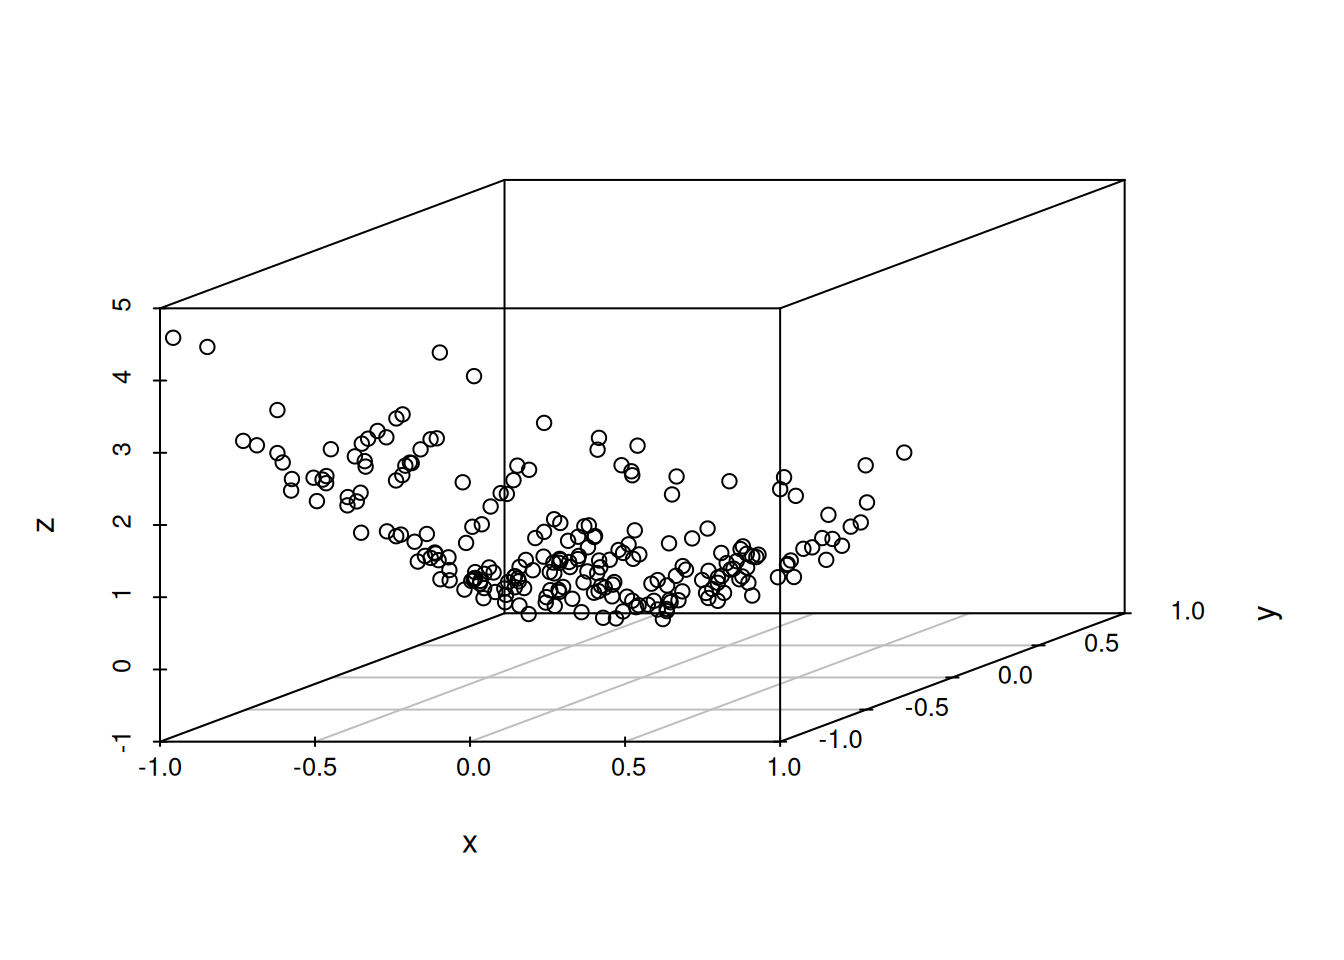
3.2.1 Principal Component Analysis
- PCA is a linear transformation of data (orthogonal change of basis)
- The new features produced by PCA are:
- Uncorrelated
- Ordered by variance
- The algorithm reduces to diagonalization of the covariance matrix
- It is critical to center (and scale) data
# First we generate data with very different variances
x = runif(20) * 30 - 15
y = runif(20) * 2 - 1
# After rotation, the high-variance direction cannot be observed
r = as.matrix(cbind(c(1,1), c(1,-1))) / sqrt(2)
girado = as.matrix(cbind(x,y)) %*% r
plot(girado[,1], girado[,2], xlab="", ylab="", asp=1)
components = prcomp(girado, center=TRUE, scale.=TRUE)
# The change of basis is the inverse of the rotation
print(components$rotation %*% r)
# PCA orders the principal components:
lines(c(0, 10), c(0, 10), col="red")
lines(c(0, -1), c(0, 1), col="green")
# Red: first PC
# Green: second PC
print(components$sdev)
summary(components)
3.2.2 Math recall: PCA and Linear Algebra
- Start by normalizing data to zero mean:
\[ X_{ij} \leftarrow X_{ij} - \frac{1}{m}\sum_i X_{ij} \]
Data is a \(n \times m\) matrix \(X\), where the variables are correlated with covariance matrix \(C\):
\[ C_{ij} = \frac{1}{n}\sum_k x_{ki} \, x_{kj} \]
- Perform orthogonal diagonalization of \(C_X=X^\top\,X\):
\[C_X=R\,D\,R^\top\]
This is possible because the \(m\times m\) covariance matrix \(C_X\) is Symmetric Positive Definite.
- Choose the first \(k\) Principal Components (PC), where the diagonal matrix \(D\) contains the variance of the PCs.
The principal components \(Y=X\,R\) are uncorrelated: \(C_Y\) is diagonal.
3.2.3 Examples
- See the three-dimensional data defined above projected on a plane:
# Data lies on a plane
grid = meshgrid(runif(15), runif(15))
x = matrix(grid$X, 225, 1)
y = matrix(grid$Y, 225, 1)
z = 2*x + 3*y + runif(225)*0.4-0.2
datos = as.data.frame(cbind(x, y, z))
# PCA finds two predominant directions
components = prcomp(datos, center=TRUE, scale.=TRUE)
print(components$sdev)
proy = predict(components, datos)
plot(proy[,1], proy[,2], xlab="", ylab="")
# Notice the different scales in x, y!!
plot(proy[,1], proy[,3], xlab="", ylab="")- Consider again the iris database and use PCA for visualization.
datos = iris[,1:4]
components = prcomp(datos, center=TRUE, scale.=TRUE)
summary(components)
y = predict(components, datos)[, 1:2]
plot(y[iris$Species=="setosa", 1], y[iris$Species=="setosa", 2],
     col="red", pch=17, xlab="", ylab="", xlim=c(-3,3.5), ylim=c(-3,3))
lines(y[iris$Species=="virginica", 1], y[iris$Species=="virginica", 2],
     col="green", pch=16, xlab="", ylab="", type="p")
lines(y[iris$Species=="versicolor", 1], y[iris$Species=="versicolor", 2],
     col="blue", pch=18, xlab="", ylab="", type="p")
We can combine PCA with \(k\)-means to visualize cluster centres too on the same plane of the two principal components:
n_clusters = 2
clustering = kmeans(datos, n_clusters)
centros = predict(components, clustering$centers)[, 1:2]
plot(y[,1], y[,2])
for (i in 1:n_clusters) {
  datos_cluster = y[clustering$cluster==i,]
  color = colors()[i*30]
  lines(datos_cluster[,1], datos_cluster[,2], col=color, xlab="", ylab="", xaxt="n", yaxt="n", xlim=c(4,8), ylim=c(0,4), type="p")
  lines(centros[i,1], centros[i,2], col=color, pch=10, type="p", cex=3)
}- Dimensionality reduction can be used as a pair encoder/decoder:
datos = iris[,1:4]
components = prcomp(datos, center=TRUE, scale.=FALSE, rank = 2)
medias = matrix(rep(components$center, nrow(components$x)), nrow = nrow(components$x), byrow = T)
encode = predict(components, datos)
base = t(components$rotation)
decode = encode %*% base + medias
n = dim(datos)[1]
m = dim(datos)[2]
sum((datos-decode)^2)/(n*m) # Reconstruction error
3.2.4 Autoencoders
- Autoencoders are another method for dimensionality reduction
- They are trendy within deep learning models
- An autoencoder is a multi-layer neural network
- An autoencoder builds a model \(y=F(x)\)
- Each layer builds an internal or hidden model
- Hidden layer: \(z_1=F_1(x)\)
- Output layer: \(y=F_2(z_1)\)
- The whole NN model is the composition: \(F=F_2\circ F_1\)
- Each internal model may be deep (many layers)
- Autoencoders are trained with output=input: \(F(x)=x\)
- Since \(F_1\), \(F_2\) are inverse, they form an encoder-decoder pair:
- Encoding: \(z_1=F_1(x)\)
- Decoding: \(x_\text{DEC}=F_2(z_1)\)
- The dimension of the code is the number of neurons in the hidden model (bottleneck)

Many variantes are possible: * Regularization: the code contains mostly zeros (sparse autoencoder) * Learning with noisi instances (denoising autoencoder)
3.2.5 Example
library(autoencoder)
datos = iris[,1:4]
# First repeat PCA
components = prcomp(datos, center=TRUE, scale.=TRUE)
y = predict(components, datos)[, 1:2]
plot(y[, 1], y[, 2])
# Now the autoencoder
datos_m = as.matrix(datos)
# Try first with the default max.iterations = 2000
autoe = autoencode(datos_m, N.hidden = 2, epsilon = 1, lambda = 0, beta = 0, rho = 0.1, rescale.flag = TRUE,max.iterations = 10000)
salida = predict(autoe, datos_m, hidden.output = TRUE)
y_AE = salida$X.output
lines(y_AE[, 1], y_AE[, 2], col="red", type="p")
# Only the first class
plot(y[1:50, 1], y[1:50, 2], xlim=c(-3,3))
lines(y_AE[1:50, 1], y_AE[1:50, 2], col="red", type="p")
# Only the second and third classes
plot(y[51:150, 1], y[51:150, 2], xlim=c(-3,3))
lines(y_AE[51:150, 1], y_AE[51:150, 2], col="red", type="p")- The output (predict) of neural networks is the real output
- The output (predict) of an autoencoder is the hidden layer (hidden.output = TRUE)
- If we hide the hidden layer (hidden.output = FALSE), we obtain the useless identity function
new_datos = predict(autoe, datos_m, hidden.output = FALSE)
cat("Reconstruction error", new_datos$mean.error, "\n")
cat("First row (data)", datos_m[1, ], "\n")
cat("First row (reconstructed)", new_datos$X.output[1, ], "\n")
# The reconstruction error can be used for anomaly detection
reconstruction_error =rowSums(abs(datos_m - new_datos$X.output))
anomaly = which.max(reconstruction_error)
cat("Error maximum (data)", datos_m[anomaly, ], "\n")
cat("Error maximum (reconstructed)", new_datos$X.output[anomaly, ], "\n")3.3 Time series
3.3.1 Autoregression
- In many problems, time is an important variable
- In regression, a variable depends on other variables: \(y=F(X)\)
- In autoregression, a variable depends on the same variable at a different time: \(x(t+1) = F(x(t))\)
- In time series, the state \(x(t)\) is a dynamical system
3.3.2 Applications
- Translation or filtering: sequence to sequence
- Classification: sequence to class
- Prediction: sequence to next value
3.3.3 Autoregressive (AR) models
- Linear regression on the same (lagged) sequence
- Many variants:
- ARMA (moving average)
- ARIMA (integrated)
- ARIMAX (external variables)
- Box-Jenkins
library(forecast)
library(readr)
# Data from http://archive.ics.uci.edu/ml/datasets/Individual+household+electric+power+consumption
household_power_consumption <- read_delim("household_power_consumption.txt",
    delim = ";", escape_double = FALSE, trim_ws = TRUE)
serie <- as.numeric(household_power_consumption$Global_active_power[1:10000])
modelo <- auto.arima(serie)
futuro = predict(modelo, n.ahead = 100)
plot(c(serie[9900:10000], futuro$pred), type="l")
3.3.4 Recurrent neural networks
- For training we can use the future values of the series
- This backpropagation through time
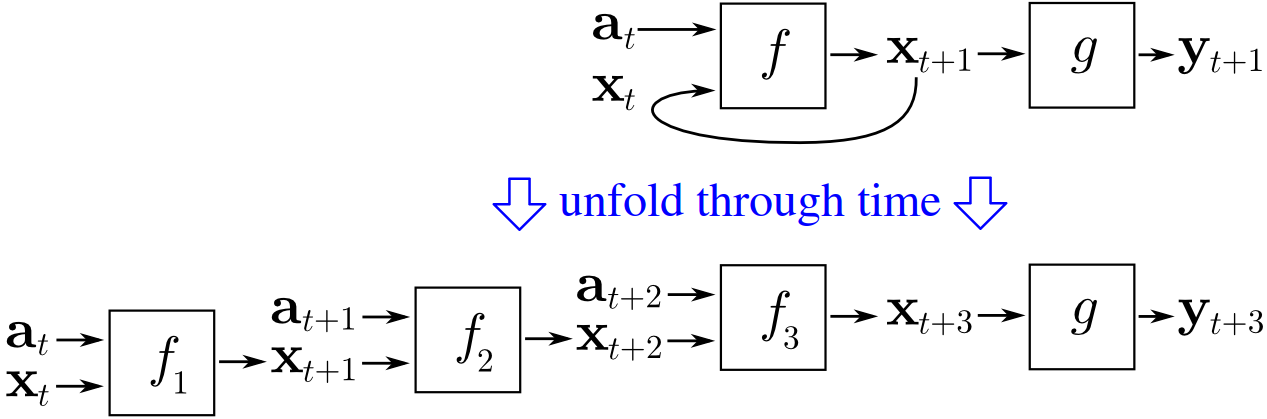
- It is equivalent to as many hidden layers as the sequence length
- Overfitting analysis is not clear
- Gradient vanishing often occurs
- In R a recurrent Neural Network is built with the package rnn
library(rnn)
# Data from http://archive.ics.uci.edu/ml/datasets/Individual+household+electric+power+consumption
serie <- as.numeric(household_power_consumption$Global_active_power[1:100])
serie <- serie / max(serie)
n = length(serie)
X = as.matrix(serie[-n])
Y = as.matrix(serie[-1])
network = trainr(Y, X, hidden_dim = 10, learningrate = 0.5, numepochs= 20)
y_pred = predictr(network, X)
plot(as.vector(Y), col='red')
lines(as.vector(y_pred), col='blue')
3.4 Assignment
- Clustering
- Execute the k-means algorithm on a freely chosen database (it can be the iris database).
- Explain the real-world meaning of the clustering task.
- Show the effect of extreme values of the number of clusters: Which is the error? Is the result meaningful for the real-world task?
- Dimensionality reduction
- Execute the PCA algorithm on a freely chosen database (it can be the iris database).
- Explain the real-world meaning of the clustering task.
- Show how the dimensionality reduction algorithm can be used as an encoder.
- Recurrent neural networks
- Perform prediction on a freely chosen time series.
- Explain the posssible uses of a prediction algorithm for time series.